How to use it in Figma, even if you have never used Figma
Four steps. You do not need to draw anything, and a free Figma account is enough (Pro components need a ProFigma Pro plan).
Fill
Export
- Press Copy to FigmaClick the button on this page. The design is copied, like text you copy with Ctrl + C.
- Paste it in FigmaOpen Figma, open any file and press Ctrl + V (Cmd + V on Mac). You get real, editable layers.
- Make it yoursDouble-click a text to type your own words. Click a shape and change its color under Fill. Drag your own photo onto an image box.
- Export itClick the design. In the right panel, scroll to Export, choose PNG, JPG, SVG or PDF, then click Export.
Tip: install the free Google Fonts used in the design (the name shows when you click a text) so the text looks the same on your computer.
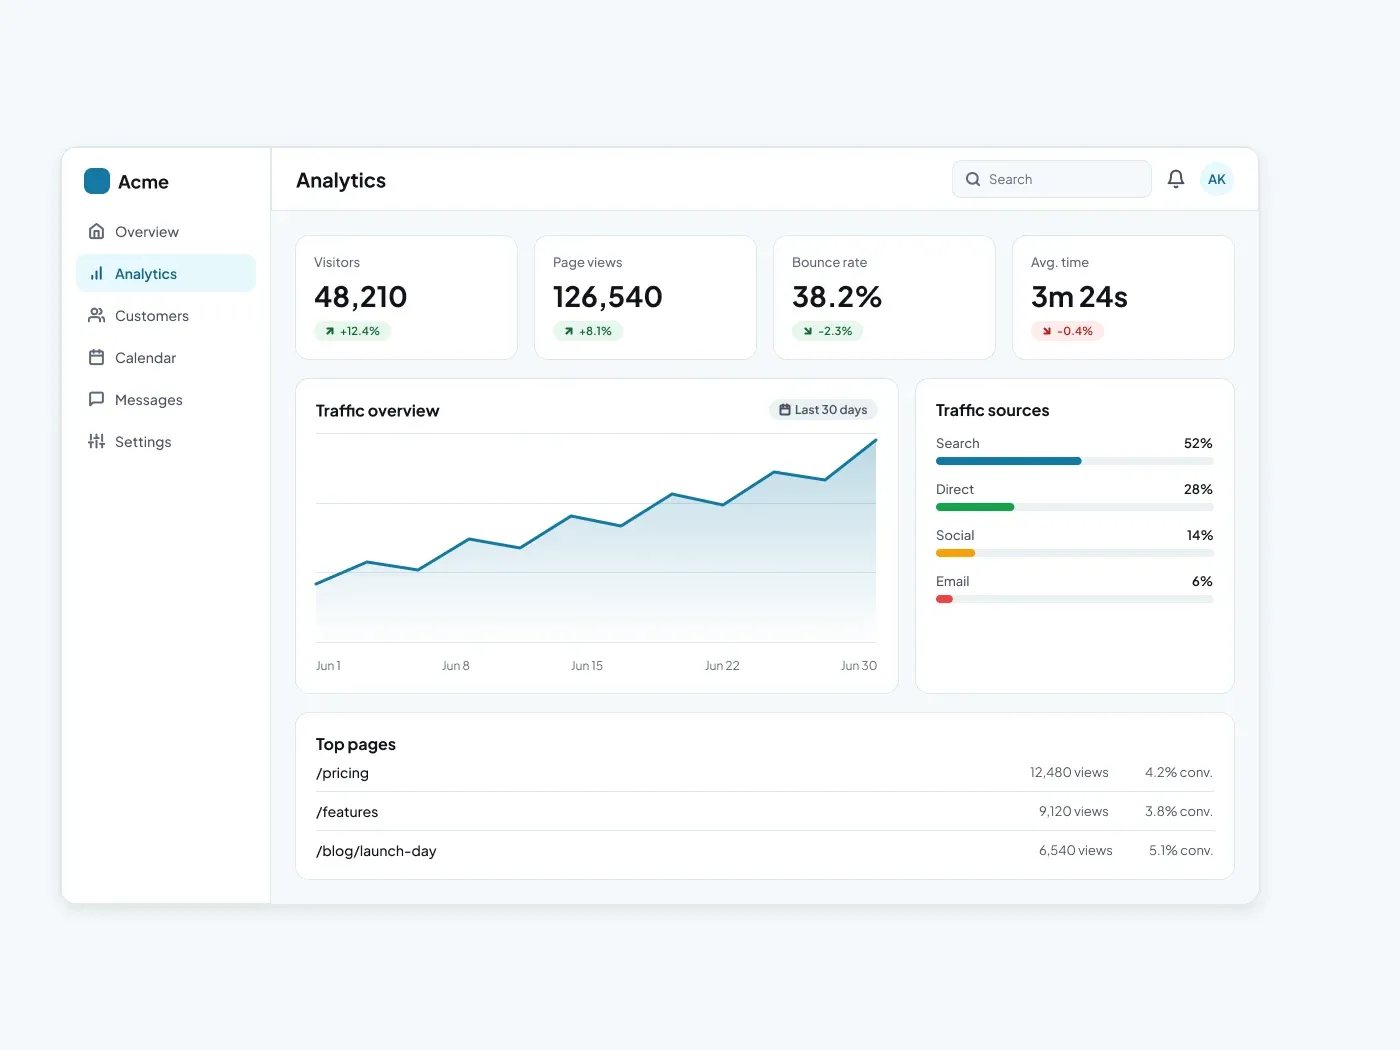
Give your team one screen for traffic. This analytics dashboard shows four key numbers, a trend chart, traffic sources and the best pages.
What is included
- A sidebar, top bar and search field
- Four stat cards with change badges
- An area chart with a date range
- Traffic sources with progress bars and a top pages list
Where to use it
Use it as the base for a web app, an admin panel or a client report. Replace the numbers and chart points.
Design notes
The app frame is 1200 px wide with a 210 px sidebar and a 64 px top bar. Stat cards have a 14 px radius and 18 px padding, and the values are 28 px Bold. The area chart is 560 by 210 px with a 3 px line and a soft gradient under it. The traffic bars are 8 px tall.
This light version uses an accent of #1478a3 on a page of #f4f9fb, with white cards. A dark version of this design is a separate listing: Premium Dark Analytics Dashboard UI for Figma.
Questions
How do I change the chart data?
The chart is a vector line. Select it and move the points, or replace the whole chart with one from your charting tool. Keep the gradient to give the area a soft base.
Can I add a fifth stat card?
Duplicate a stat card. The row uses auto layout, so the cards share the width, which drops each card to about 160 px. Shorten the labels if needed.
Is there a dark version?
Yes. Premium Dark Analytics Dashboard UI for Figma has the same layout on a soft charcoal page, with the same accent color.
How to use it
Copy the component with the copy button and paste it into Figma with Ctrl+V or Cmd+V. The text uses Plus Jakarta Sans, which is free on Google Fonts.